AGNC Investment (AGNC)·Q4 2025 Earnings Summary
AGNC Caps Exceptional Year with 11.6% Economic Return, Book Value Surges 7.2%
January 27, 2026 · by Fintool AI Agent
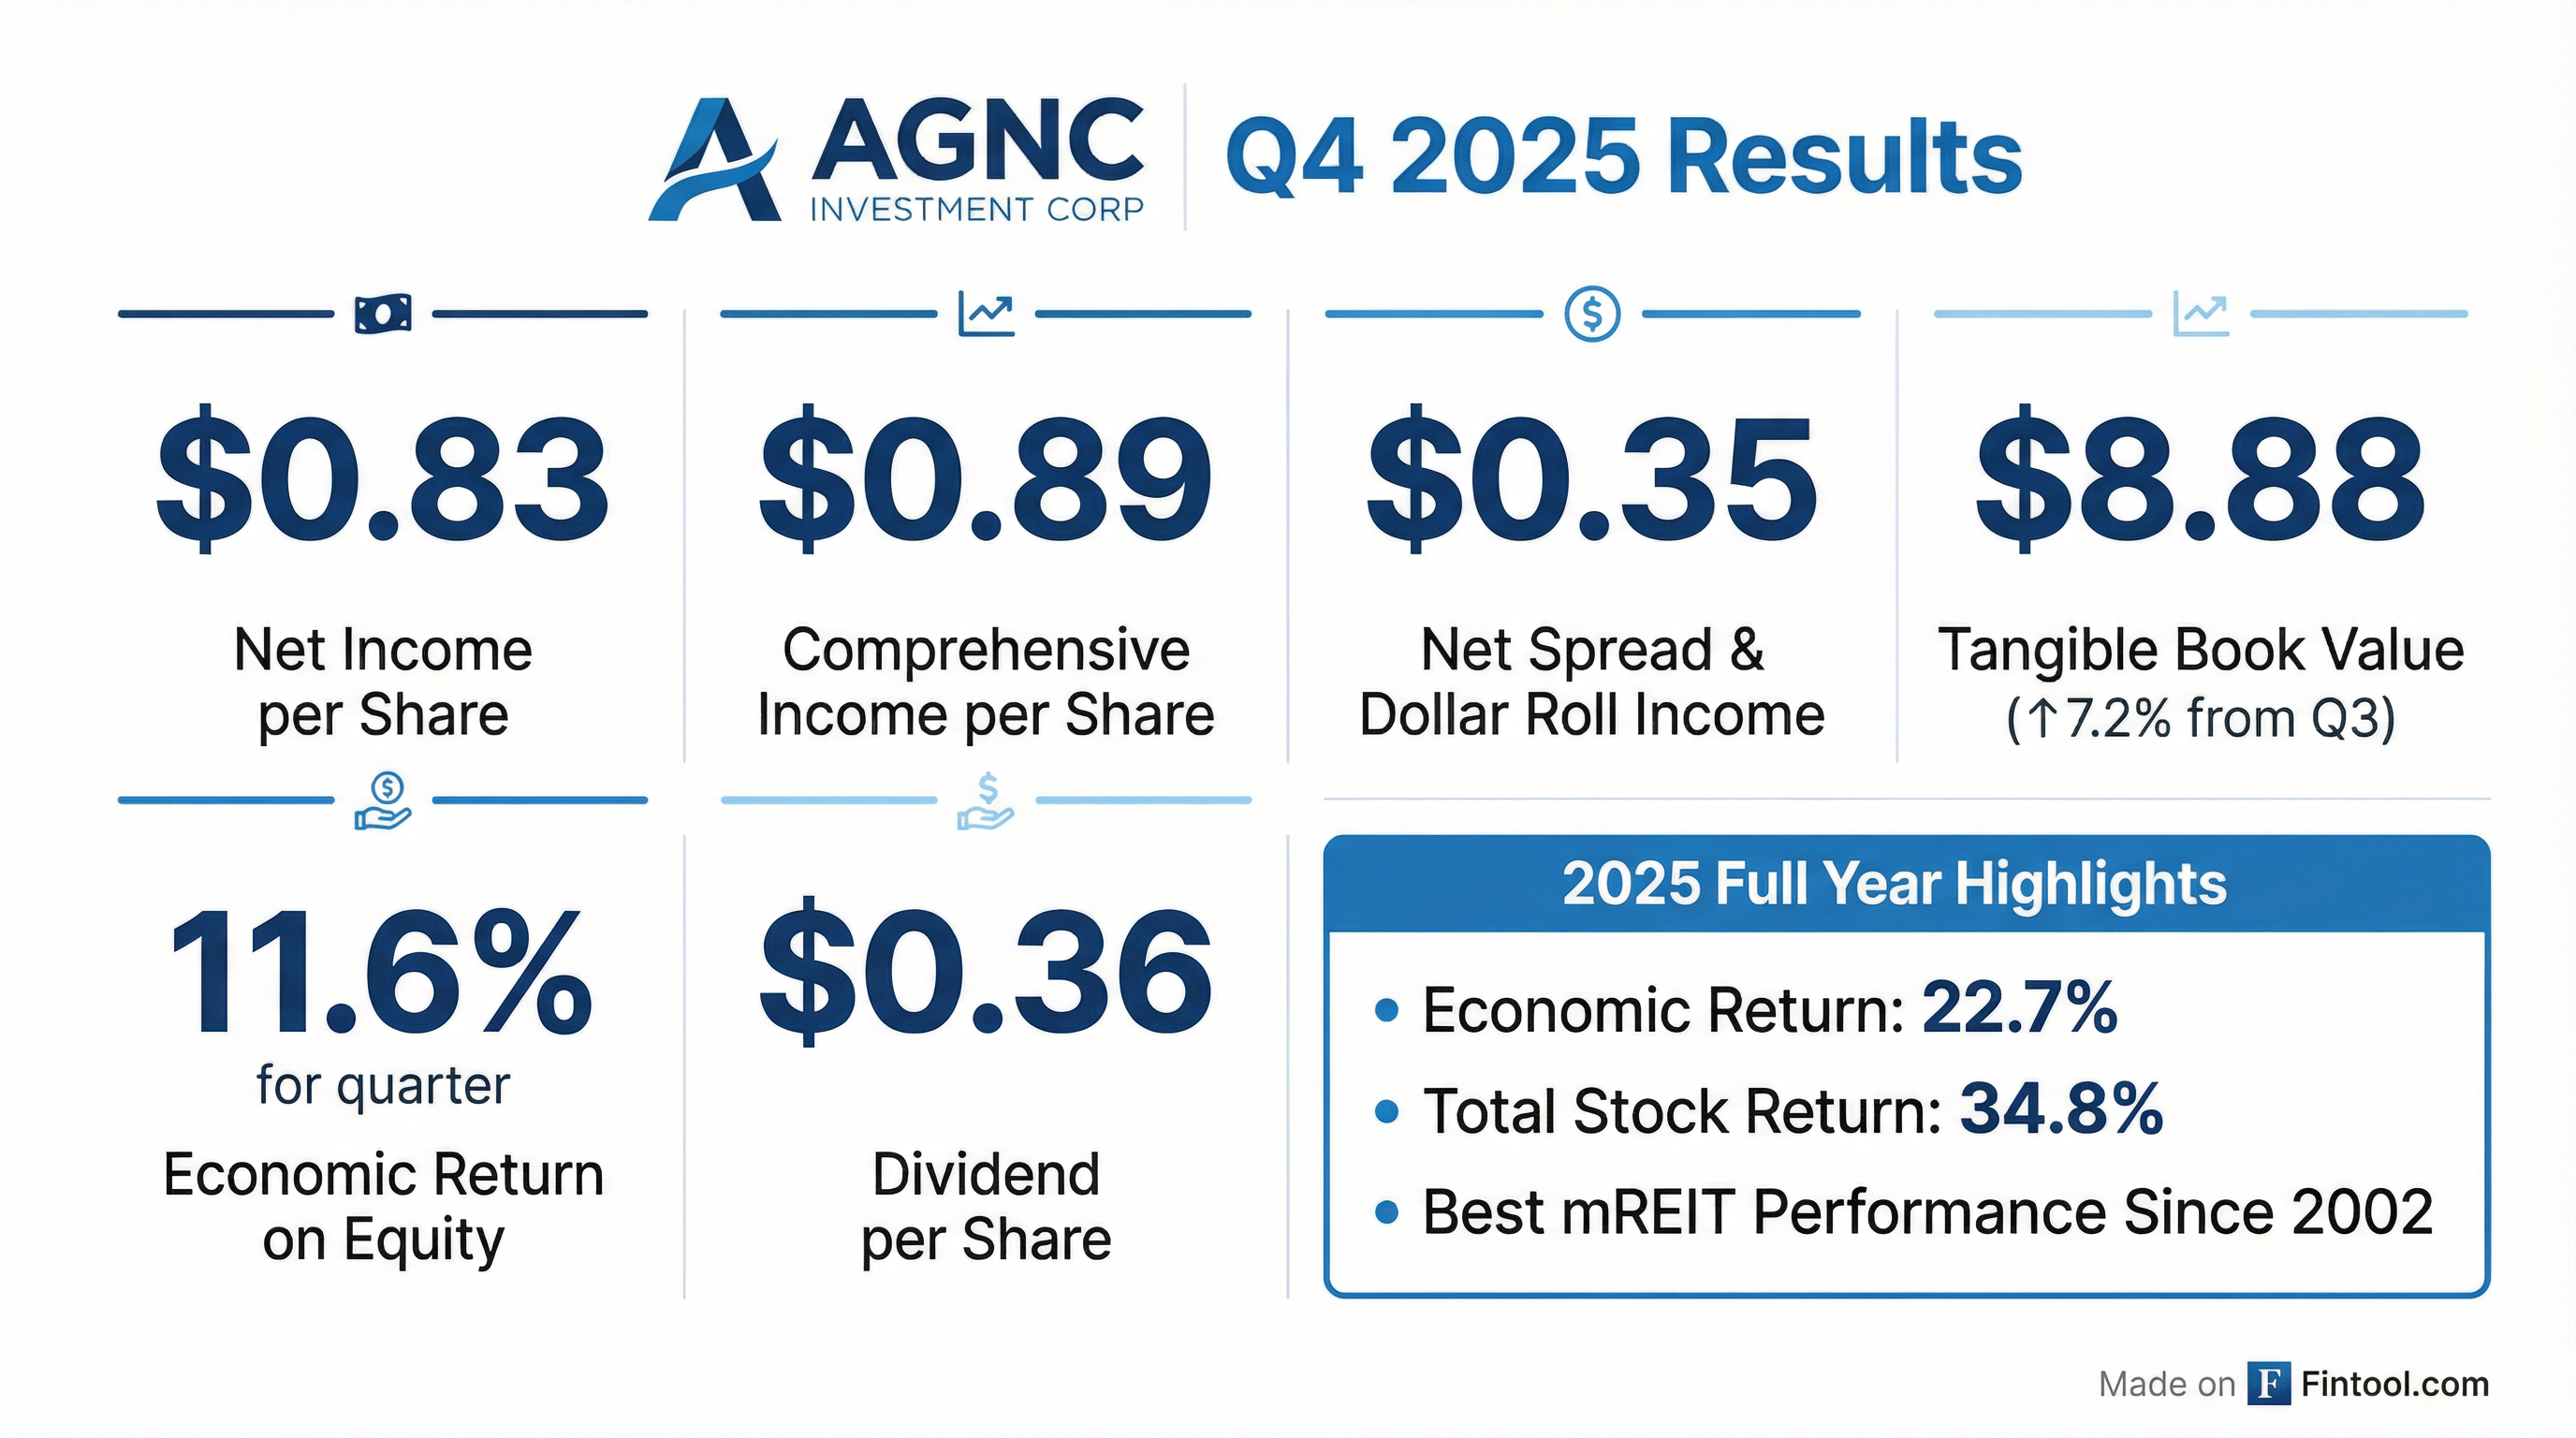
AGNC Investment Corp (NASDAQ: AGNC) reported Q4 2025 results that capped what management called "an exceptional year" for shareholders. The mortgage REIT delivered an 11.6% economic return on tangible common equity for the quarter, driven by a 7.2% surge in tangible book value to $8.88 per share. Full-year 2025 economic return reached 22.7%, with total stock return of 34.8% — nearly double the S&P 500's performance.
Since its May 2008 IPO, AGNC has delivered a 559% total stock return and paid $15.5 billion in total dividends — a testament to the company's position as the premier agency residential mortgage REIT. The stock currently yields 13.4% with a market cap of $11.9 billion.
Did AGNC Beat Earnings?
AGNC's Q4 results were mixed depending on the metric, but the overall picture was strong:
Net spread and dollar roll income (the non-GAAP metric most mREIT investors track) came in at $0.35 per share, matching Q3 but below consensus expectations of ~$0.39. However, this metric tells only part of the story — the comprehensive income of $0.89 per share and surge in book value reflect significant mark-to-market gains as Agency MBS spreads tightened.
January Update: As of late last week, tangible book value was up approximately 4% for January, or 3% net of the monthly dividend accrual.
How Did the Stock React?
AGNC shares closed at $11.80 on January 26, 2026, down 0.42% from the prior close. The muted reaction suggests results largely met expectations:
- 52-week range: $7.85 - $11.93
- Current price vs. 50-day avg: $11.80 vs. $10.75 (+9.8%)
- 2025 total return: 34.8% (with dividends reinvested)
Trading near its 52-week high, the stock reflects a strong full-year performance. The muted post-earnings move suggests investors had already priced in favorable MBS spread dynamics.
What Changed From Last Quarter?
Several key metrics improved sequentially:
The Fed's rate cuts directly benefited AGNC by lowering funding costs while Agency MBS spreads tightened, creating a favorable environment for the company's leveraged portfolio strategy.
What Did Management Guide?
CEO Peter Federico struck an optimistic tone on the outlook, providing specific spread and return expectations:
"As we begin 2026, these favorable macro themes remain in place and provide a constructive investment backdrop for our business. In addition, other positive developments are possible, including further actions by the administration to improve housing affordability."
Spread Range Guidance: Federico outlined a new, tighter spread environment:
- Current coupon to swaps: 120-160 bps range, currently ~135 bps
- Current coupon to Treasuries: 90-130 bps range, currently ~110 bps
Expected Returns: At current spread levels, management expects ROE in the 13%-15% range, well-aligned with the dividend and cost of capital.
"When you think about the dividend, the return on our existing portfolio... that's about an ROE of 16%. And that aligns very, very well with our total cost of capital."
Key management commentary highlights:
-
Agency MBS outlook: Best performing domestic fixed income asset class in Q4 2025. The Bloomberg Aggregate Agency Index was the best-performing fixed income sector in Q4 and produced a total return of 8.6% for the year.
-
GSE purchases: The $200 billion MBS purchase announcement from the GSEs is the type of action that could result in tighter mortgage spreads.
-
Supply/demand outlook: Net new supply of ~$200B in 2026; with Fed runoff, private sector absorbs ~$400B — similar to prior two years. GSE purchases could consume about half of this supply.
-
Capital deployment: No equity issuance quarter-to-date (blackout period), and future issuance will be "opportunistic" based on economics rather than growth targets.
Q&A Highlights: What Analysts Asked
On Dividend Coverage: Analyst Bose George (KBW) pressed on whether tighter spreads threaten the dividend. Federico explained that the existing portfolio ROE of ~16% covers the 15.8% total cost of capital. New capital deployed at 13%-15% still exceeds the 12% dividend yield on the stock, providing ample coverage.
On Spread Risk: Doug Harter (UBS) asked about upside/downside to the spread range. Federico noted several positive catalysts — GSE cap changes, potential Fed balance sheet shifts, or expanded standing repo programs — could push spreads tighter. On the downside, streamlined refinance programs or G-fee changes could widen spreads due to increased prepayment risk.
"The key differentiator, which is very positive, is that they [policymakers] are limiting the upside of the range. They are saying, 'We want spreads to stay here or go lower.'"
On Leverage: With spreads tighter, AGNC reduced leverage to 7.2x from 7.6x. Federico indicated they need more information on spread stability before adjusting leverage targets.
On Swap Spreads: Trevor Cranston (Citizens JMP) asked about the swap spread outlook. Federico expects further widening as the Fed shifts from QT to reserve management, picking up 25-30 bps extra carry at current levels — translating to 1-2% additional ROE at current leverage.
On Prepayment Risk: Eric Hagen (BTIG) asked about refi sensitivity. Federico highlighted that 87% of their 5.5+ coupon portfolio has specified pool characteristics that should dampen prepayment speeds. As an example, their 6.5% coupon pools are paying at less than half the CPR of the cheapest-to-deliver cohort.
Portfolio and Risk Metrics
AGNC ended Q4 with a $94.7 billion investment portfolio:
- 30-Year Fixed MBS: $77.0 billion (81%)
- 30-Year TBA: $12.8 billion (14%)
- Other Agency MBS: $3.6 billion (4%) — multifamily, ARM, CMO
- Credit Securities: $0.6 billion (1%) — CRT, CMBS, Non-Agency RMBS
Portfolio weighted average coupon: 5.12%, with 76% in specified pools and other pools with favorable prepayment attributes.
Risk management position:
- Hedge ratio: 77% of total funding liabilities (unchanged QoQ)
- Swap-based hedges: 70% of hedge portfolio (up from 59% in Q3) — shifted toward swaps given favorable swap spread outlook
- Hedge portfolio: $59 billion notional
- Duration gap: 0.4-0.5 years, likely to widen further if 10-year rates stay elevated
- Sizable receiver swaption position for down-rate protection
- Liquidity: $7.6 billion unencumbered (64% of tangible equity)
Full Year 2025 Performance
Capital markets activity for 2025 included:
- $2.0 billion raised via ATM common stock offerings
- $345 million Series H preferred equity issuance at 8.75%
What Are the Key Sensitivities?
AGNC provides detailed sensitivity analysis for interest rates and MBS spreads — critical data for mREIT investors managing portfolio risk:
Interest Rate Sensitivity (assuming instantaneous parallel shift):
MBS Spread Sensitivity (basis risk):
The asymmetric profile shows AGNC benefits significantly from spread tightening while rate risk is relatively well-hedged. Duration gap widened slightly to 0.4 years from 0.3 years in Q3.
Key Risks and Concerns
While management was bullish, several risks remain:
-
Interest rate sensitivity: Despite hedging, +50 bps rate shock could reduce tangible equity by 4.3%
-
Prepayment risk: CPR projections at 9.6%, with higher-coupon pools (≥6.5%) running at 31-34% CPR
-
Dividend coverage: Net spread and dollar roll income of $0.35 barely covers the $0.36 dividend, though management notes total cost of capital (15.8%) aligns well with existing portfolio ROE (~16%)
-
Leverage: At 7.2x, AGNC remains highly leveraged to MBS performance
Upcoming Events
- Stockholder Presentation: January 27, 2026
- Q4 2025 Materials: Available at AGNC.com
View the full Q4 2025 earnings call transcript and 8-K filing for complete financial statements and exhibits.